
Profiling your Swift compilation times
· 3 minute read
UPDATE: It’s possible to do this entirely from the command line, without modifying your Xcode project at all. Simply run the following (thanks to Mike Skiba and Eric Slosser for their help with this):
xcodebuild -workspace App.xcworkspace -scheme App clean build OTHER_SWIFT_FLAGS="-Xfrontend -debug-time-function-bodies" | grep .[0-9]ms | grep -v ^0.[0-9]ms | sort -nr > culprits.txt
I had a problem. The new iOS application that I’m working on – written 100% in Swift – was noticeably taking much longer to compile than should, given its size (~200 files). More concerning, it was suddenly a lot slower than only a couple of weeks prior. I needed to get to the root of the problem as soon as possible, before it got any worse.
The first step was to add -Xfrontend -debug-time-function-bodies to my Swift compiler flags:
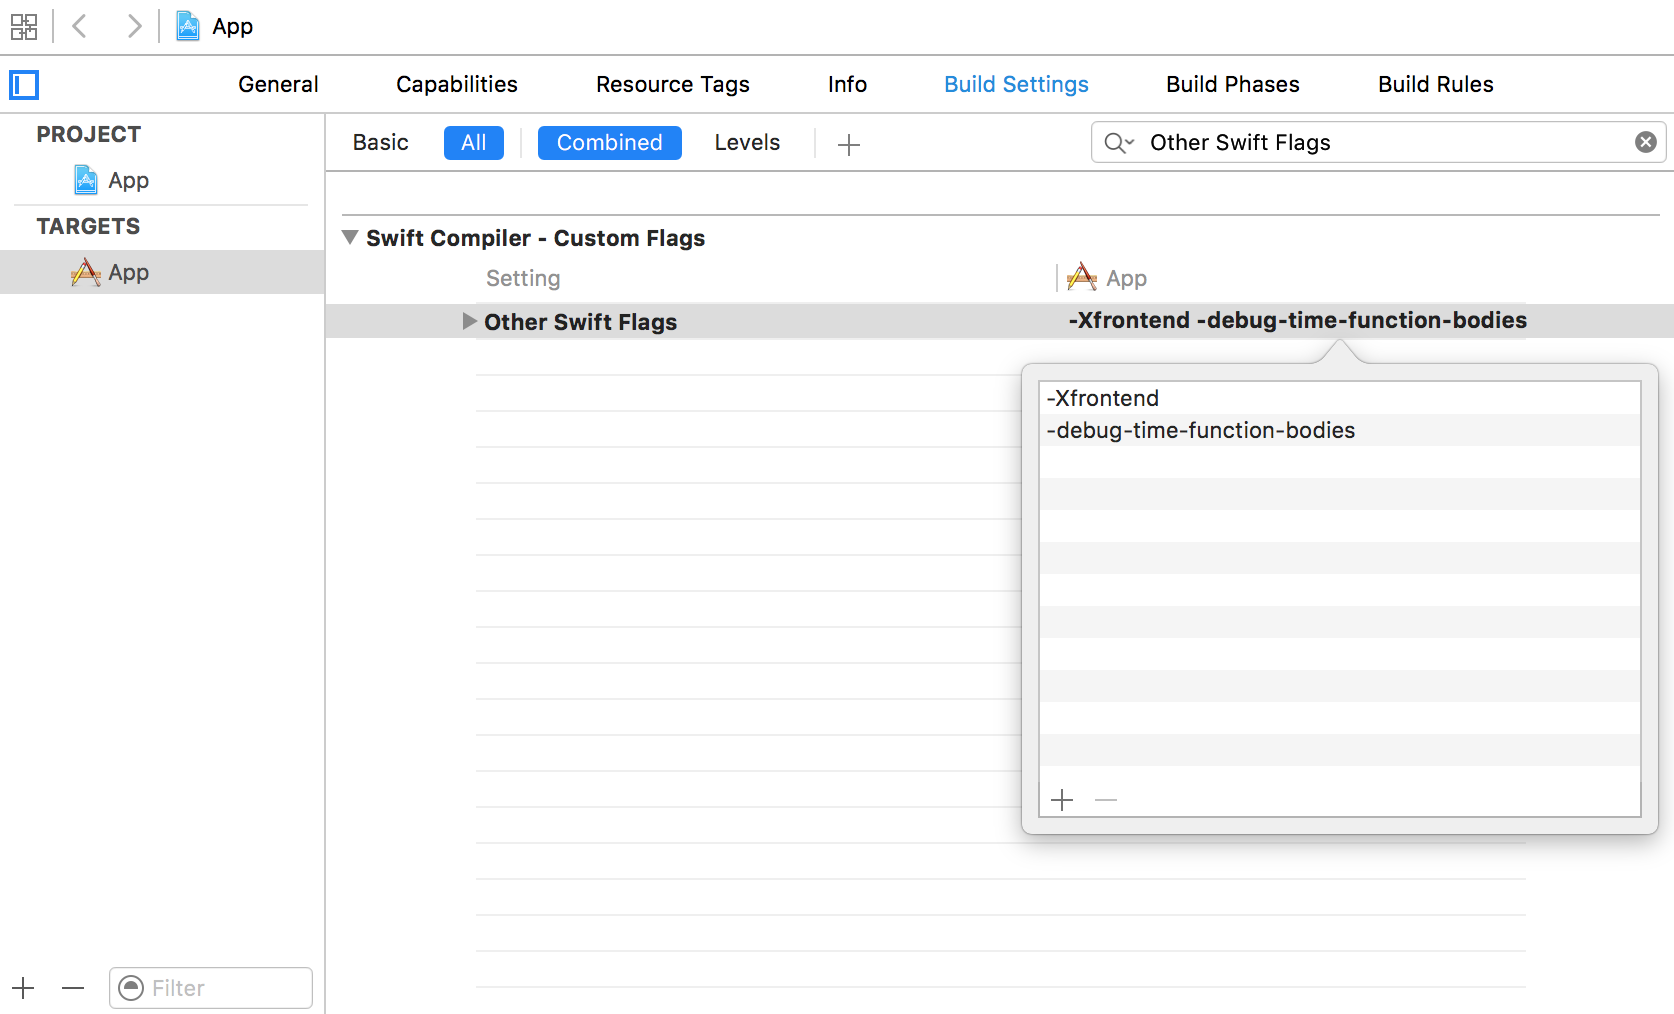
This causes the compiler to print out how long it takes to compile each function (thanks to Kevin Ballard for clueing me into these). The debug logs are visible in Xcode’s report navigator, but only by manually expanding each individual file:

The next step was to aggregate all of these logs together in one place in order to make sense out of them.
Rather than building via Xcode itself, using the xcodebuild command line tool results in the logs being printed to standard output, where we can massage them to our liking:
# Clean and build, capturing only lines containing `X.Yms` where X > 0, sorting from largest to smallest
xcodebuild -workspace App.xcworkspace -scheme App clean build | grep [1-9].[0-9]ms | sort -nr > culprits.txt
At this point, the question was whether I’d actually be able to derive actionable insights from the output, and I most certainly was. Thought my culprits file highlighted any function that took over a millisecond to compile, I actually had 1,200+ cases in which a function took more than a second, with many taking over three seconds. Thankfully, these 1,200+ lines were actually all the same three functions repeated many times over again (I don’t know enough about compilers to understand why this is the case, but the inclusion of “closure” in the output sample below does shed a bit of light).
3158.2ms	/Users/Bryan/Projects/App/FileA.swift:23:14	@objc get {}
3157.8ms	/Users/Bryan/Projects/App/FileA.swift:23:52	(closure)
3142.1ms	/Users/Bryan/Projects/App/FileA.swift:23:14	@objc get {}
3141.6ms	/Users/Bryan/Projects/App/FileA.swift:23:52	(closure)
3139.2ms	/Users/Bryan/Projects/App/FileA.swift:23:14	@objc get {}
3138.7ms	/Users/Bryan/Projects/App/FileA.swift:23:52	(closure)
3128.3ms	/Users/Bryan/Projects/App/FileB.swift:27:22	final get {}
3109.9ms	/Users/Bryan/Projects/App/FileA.swift:23:52	(closure)
3052.7ms	/Users/Bryan/Projects/App/FileA.swift:23:14	@objc get {}
3052.6ms	/Users/Bryan/Projects/App/FileA.swift:23:14	@objc get {}
3052.2ms	/Users/Bryan/Projects/App/FileA.swift:23:52	(closure)
3052.1ms	/Users/Bryan/Projects/App/FileA.swift:23:52	(closure)
3049.0ms	/Users/Bryan/Projects/App/FileB.swift:27:22	final get {}
3026.1ms	/Users/Bryan/Projects/App/FileB.swift:27:22	final get {}
Even crazier, each of these three functions was only a single line of code. Rewriting just these three lines of code caused my entire project to build 60% faster. I could see this enraging many, but honestly I was just so happy to have figured out the sources of the bottleneck, as well as to now know how to troubleshoot the next time I found myself in a similar situation.
You might be wondering what in the world these three lines looked like. All were (perhaps unsurprisingly) very similar, taking a form like:
return [CustomType()] + array.map(CustomType.init) + [CustomType()]
I can’t speak to whether or not the crux of the problem was the appending, the mapping, or the combination of the two. Rather than try and hone in on the smallest change I could make that would yield suitable performance, I simply rewrote these functions to be as naively imperative as I could: mutable intermediate variables, ostensibly unnecessary type definitions, the works. I’m hardly the first to discover that array appending is slow, but it took experiencing the pain firsthand to realize the ease with which one can find themselves having a bad time thanks to an elegant and seemingly innocuous line of code.
Swift is still an incredibly young language and it shouldn’t be surprising that there are still rough edges like this for us to, as a community, collectively find and help sand down. As we learn more about how to instrument our code, and in turn, what the compiler’s pain points are, we’ll become better at helping one another avoid such pitfalls, and helping those working on Swift itself prevent them from happening in the first place.